5 Top-notch WordPress Chart Plugins for Data Visualization

Data is always key to consolidating your claim and if you have a website, displaying data is always vital. But if you showcase data only through non-stop writing, it gets monotonous. Even if you list data in tables, it’s not always appealing. This is where data visualization comes into play. This write-up, going forward, will dilate upon top WordPress chart plugins.
Data visualization is a mesmerizing way to present facts and information on a website. It includes pictures, graphs, diagrams, maps, and other visual formats. You can present various facts or figures about your business or other necessary numbers using these charts.
As a matter of fact, WordPress has a bounty of data visualization or chart plugins. But all of them aren’t worth trying due to lack of quality or high cost.
In this write-up, I have rounded up 5 top-rated WordPress chart plugins that you can deploy on your site. These plugins will let you enumerate data visually on your website and engage visitors. I will cut to the chase shortly but before that, let me clarify the concept of data visualization or chart.
Recommended: Top 7 WordPress table plugins you can also read
Data Visualization:
Data visualization is a very common term in this digital age. It’s basically a graphical or pictorial representation of facts and information. Simply put, if you translate information into different types of charts like graphs, pictures, diagrams, infographics, etc. it’s nothing but data visualization.
According to a study by Aberdeen Group, in organizations using visual data discovery tools, 48% of the managers can find the information they need without the help of IT staff.
If you make use of data visualization to showcase your site data, not only you can glamorize your site but also grip your site’s visitors.
Let me simplify the point with a realistic example. Let’s say, you want to present the market share of different e-commerce platforms like WooCommerce, Shopify, BigCommerce, Magento, etc. After doing your research, you can present the figure in a table, in plain writing, or in a colorful and catchy graph. Which one do you think readers will find more exciting and digestible?
It should be a graph, either in the form of a histogram or pie chart. Why? Because in this way, they are getting facts in one place with an added charm. In the case of plain writing, they have to go through each line and know the facts.
In the case of a table also, they have to eyeball more as compared to a graph. That’s why data visualization plays a key role in making information palatable and imposing.
Top 5 WordPress Chart Plugins:
The wait is over! Now, I will introduce you to the top 5 WordPress chart plugins. With these plugins, you can create charts or data visualizations with ease. Let’s cut to the chase…
ElementsKit:
The first WordPress chart plugin that I have in my round-up is ElementsKit. It’s primarily a page builder for Elementor that comes with an array of widgets and features. One of those widgets is a chart widget that you can deploy to generate different types of charts.

These charts include a bar chart, pie chart, line chart, radar chart, polar chart, doughnut chart, and so on. You can add relevant data on these charts and visualize them to your site visitors appealingly.
ElementsKit will let you customize the chart content and style the chart full of splendor. You can spice up your tables and charts by modifying data, color, category, tooltip, label, title, animation, etc.
Key Features:
- Comes with advanced filters and search options
- Responsive WP tables and charts to any device
- Scores of styling options
- Unlimited customization options
- Tons of chart types are available
Price: Basic features are free to use which include the Pie chart widget. But if you want to unlock the Chart widget and get access to all the features, you have to buy the premium version. The Professional package of ElementsKit costs $68/Year for 5 sites.

Passionate to know about the best WordPress accordion plugins? Head over to the blog clicking the link below-
wpDataTables:
Businesses nowadays boast ample data, some of which require to be charted and displayed on your website. A number of data visualization plugins exist that can do the job. But most of them lack quality and display random and messy data.

This is where wpDataTables come into play as it comes with useful features required to show data in an organized way. No matter whether it’s a desktop or a mobile device, the plugin is a marvelous one to create elegant charts and graphs.
You can type your data or upload files to add data on charts at an ease. Additionally, you can create filters to showcase data based on date, location, etc. As a whole, wpDataTables is a perfect one to show any kind of data including financial, commercial, and statistical.
Key Features:
- Creates responsive WordPress tables and charts
- Contains advanced filters and search
- Highlighting cells, rows, and columns
Price: The Pro package costs $109 for 3 domains/Year
Visualizer:
Visualizer is a WordPress table and chart plugin that lets you create fascinating data visualizations on your site. With the free version of this plugin, you can create 9 types of charts- line charts, area charts, bar charts, column charts, pie charts, geo charts, table charts, bubble charts, and scatter charts.

However, if you go for the pro version, you will get access to 6 more charts as well as email support. Additionally, you can create interactive tables like the pricing table with this amazing tool. Pagination is also available in case tables go long.
Visualizer lets you modify different parameters of your tables and charts like colors, axes, placement, line-width, etc. In addition, you can let your users print or download tables and charts in multiple formats.
Key Features:
- Imports data from multiple sources
- 15 chart types (9 in the free version) available
- A 30-day money-back guarantee option can be utilized
Price: The Developer package costs $199/Year for 3 sites
Data Tables Generator:
Another top-notch WordPress chart plugin that I have picked in this list is Data Tables Generator. It offers responsive charts and tables that you can fit easily into your website’s design and structure. However, charts can be created only in the premium version as the free version is limited to only tables.
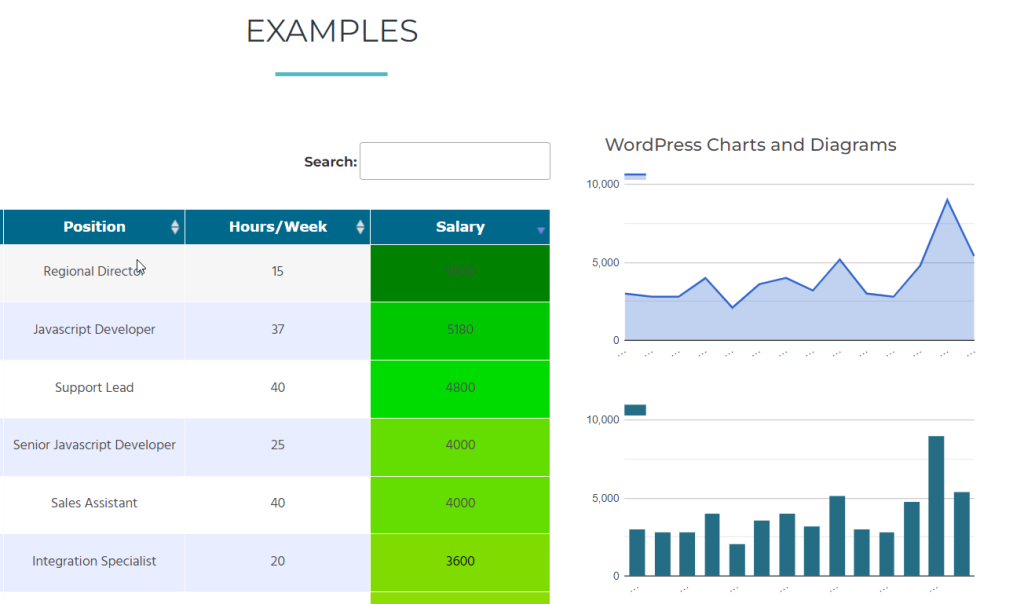
You can do catchy styling to your data visualization and present data strikingly with the intuitive Settings panel. The specialty of the plugin is its ability to integrate with WooCommerce and add the “add to cart” button to create order forms.
Right from pie charts, bar charts, and column charts to bubble charts, 3D bar charts, and 3D pie charts, all of them you can create with this easy-to-use plugin. On top of that, it will let you create different types of diagrams and graphics with all the vital parameters.
Key Features:
- Users can search, filter, and sort tables
- Generates interactive with a built-in spreadsheet editor
- Customizable data tables
Price: The Developer package costs $69/Year for 5 sites
Graphina:
A versatile WordPress plugin, Graphina lets you create a number of charts with a raft of variations. The plugin is built on Apex with plenty of options and adaptability. It’s a wonderful WordPress chart and graph plugin letting you represent data and numbers in dynamic graphs and charts.

Graphina Pro is robust with dynamic data, mixed charts, new counters, data tables, and nested column charts. Once you activate the plugin, you will get 5 Elementor page builder widgets including a line chart, pie chart, column chart, donut chart, and radar chart.
Graphina is easy-to-use and compatible with all the popular browsers like Chrome, Firefox, Safari, etc. It comes with an interactive and eye-pleasing interface creating a wow factor in you. Additionally, it’s Ajax-based ensuring a seamless site speed.
Key Features:
- 14+ graphs and charts with 1000+ variations
- 6 months of support included for CodeCanyon buyers
- Compatible up to WordPress 5+
Price: Costs $39 for 1 year
Over to you:
That’s all with the top 5 WordPress chart plugins for data visualization. Now, it’s your job to pick and choose the WordPress chart plugin that fulfills your needs. Before choosing any one of these plugins, you would emphasize 2 major factors naturally- quality and price.
I would recommend you to go for ElementsKit as it comes with both free and pro versions. Many features of data visualization you will get in the free version. For some additional ones, you have to choose the premium version.
But if you ponder over it, the premium version won’t cost you arms especially considering the number of features you will get. So, are you ready to choose the best WordPress chart plugin to visualize data for your site visitors?
Did you hear about one-page navigation before? Sounds exciting, right? Introduce yourself to the top one-page navigation plugins by clicking the link underneath-


